Extracting daily weather data from Singapore weather Station (R::weatherData)
This is a post to extract open weather data available for the weather stations in Singapore, using weatherData package in R. The sources of the available open weather data available are collected from weather stations located at airports in Singapore. Please refer to https://ram-n.github.io/weatherData/ for more information on the weatherData package.
Aims
- To extract available weather data from Singapore from 2010 to current system date in a single data frame
- To provide a quick visualisation of daily mean Temperature, Humidity, Dew, WindSpeed and Visibility
Extracting weather data from Singapore
- Load data wrangling and visualisation packages
libs <- c("plyr", "dplyr", "ggplot2", "grid", "gridExtra")
lapply(libs, require, character.only=T)
rm(libs)
- Retrieve station codes for Singapore
library(weatherData)

# Gets the weather station code for a location
getStationCode("Singapore")
## [1] "   PAYA LEBAR       WSAP        48694  01 22N  103 55E   32   X     T          6 SG"
## [2] "   SINGAPORE/TENGAH WSAT        48687  01 22N  103 43E   12   X                7 SG"
## [3] "   SINGAPORE/SELETA WSSL        48692  01 25N  103 52E   14   X     T          7 SG"
## [4] "   SINGAPORE/CHANGI WSSS  SIN   48698  01 22N  103 58E   16   X     T          6 SG"
- Check current data from each stattion
stn <- c("WSAP", "WSAT", "WSSL", "WSSS")
lapply(stn, getCurrentTemperature)
## Warning in getDetailedWeather(station_id, Sys.Date(), opt_warnings = TRUE): Unable to get data from URL
##
##  Check Station name WSAT
##
##  Check If Date is in the future 2017-04-14
##
##  Inspect the validity of the URL being tried:
##  http://www.wunderground.com/history/airport/WSAT/2017/4/14/DailyHistory.html?format=1

## For Airports, try the 4-letter Weather Airport Code

## [[1]]
##                   Time TemperatureC
## 14 2017-04-14 17:00:00           30
##
## [[2]]
## NULL
##
## [[3]]
##                   Time TemperatureC
## 18 2017-04-14 17:00:00           30
##
## [[4]]
##                   Time TemperatureC
## 43 2017-04-14 18:00:00           29
Note: No available data for WSAT
- To prevent long server enquiries, dates are section into year-long periods between 2010 and current system date(Sys.Date), which is 2017-04-14 in this case
# Getting data from SINGAPORE/CHANGI (SIN)
start <- paste0("201",1:7, "-01-01")
end <- paste0("201",2:8, "-01-01")
end[length(end)] <- Sys.Date() %>% as.character
- Extract data for three stations into separate data.frame with Station identifier
stn <- c("WSAP", "WSSL", "WSSS")

df_list <- lapply(stn, function(y) lapply(1:length(start), function(x)getSummarizedWeather("WSSS", start_date=start[x],
                                                        end_date=end[x],opt_all_columns=T)))

for(i in 1:length(stn)) assign(stn[i], do.call(rbind, df_list[[i]]))

# add station identifier
for(i in stn){
  tmp <- get(i)
  tmp$Station <- i
  assign(i, tmp)
  rm(tmp)
}
- Combining WSAP, WSSL and WSSS
weatherData <- do.call(rbind, lapply(stn, get))
head(weatherData)
##         Date     X_08 Max_TemperatureC Mean_TemperatureC Min_TemperatureC
## 1 2011-01-01 2011-1-1               31                28               25
## 2 2011-01-02 2011-1-2               31                28               26
## 3 2011-01-03 2011-1-3               31                27               24
## 4 2011-01-04 2011-1-4               31                28               25
## 5 2011-01-05 2011-1-5               32                28               24
## 6 2011-01-06 2011-1-6               29                27               24
##   Dew_PointC MeanDew_PointC Min_DewpointC Max_Humidity Mean_Humidity
## 1         25             24            24          100            85
## 2         25             24            24           94            83
## 3         26             24            23           94            88
## 4         25             24            23          100            84
## 5         26             24            23          100            85
## 6         25             24            23          100            93
##   Min_Humidity Max_Sea_Level_PressurehPa Mean_Sea_Level_PressurehPa
## 1           66                      1009                       1007
## 2           66                      1010                       1007
## 3           70                      1010                       1008
## 4           70                      1009                       1007
## 5           66                      1008                       1007
## 6           79                      1010                       1008
##   Min_Sea_Level_PressurehPa Max_VisibilityKm Mean_VisibilityKm
## 1                      1004               10                10
## 2                      1005               10                10
## 3                      1006               10                10
## 4                      1005               10                10
## 5                      1004               10                 9
## 6                      1007               10                 9
##   Min_VisibilitykM Max_Wind_SpeedKm_h Mean_Wind_SpeedKm_h
## 1                8                 24                  10
## 2                9                 23                  13
## 3                4                 19                   8
## 4                8                 19                   8
## 5                2                 23                  10
## 6                2                 10                   5
##   Max_Gust_SpeedKm_h Precipitationmm CloudCover            Events
## 1                 NA               0          6 Rain-Thunderstorm
## 2                 NA               0          5
## 3                 NA               0          6 Rain-Thunderstorm
## 4                 NA               0          6
## 5                 34               0          5 Rain-Thunderstorm
## 6                 NA               0          6 Rain-Thunderstorm
##   WindDirDegrees Station
## 1             19    WSAP
## 2             25    WSAP
## 3              9    WSAP
## 4              8    WSAP
## 5              3    WSAP
## 6            354    WSAP
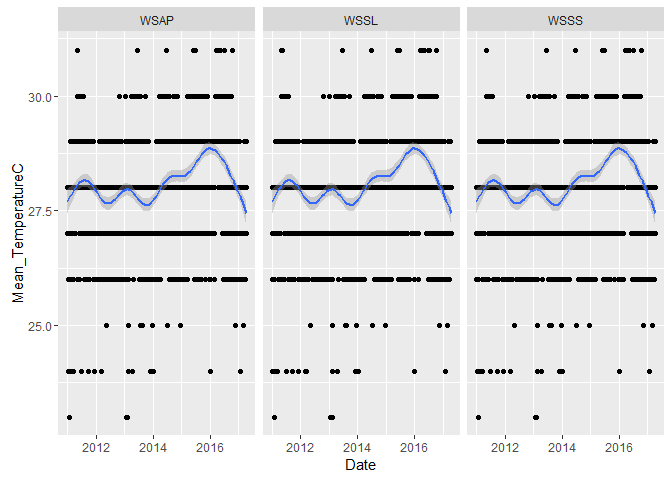
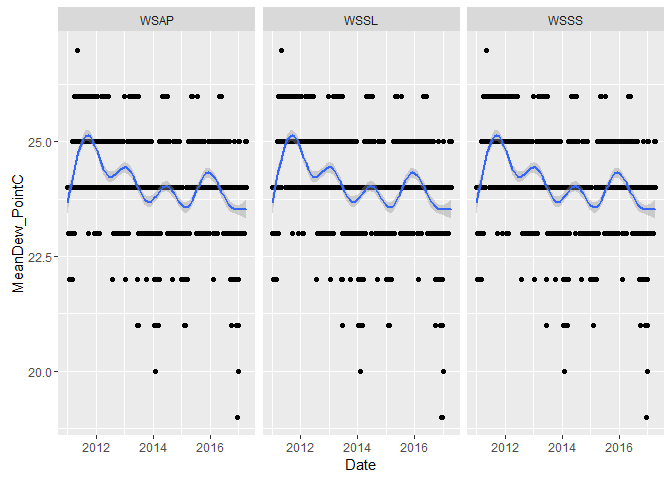
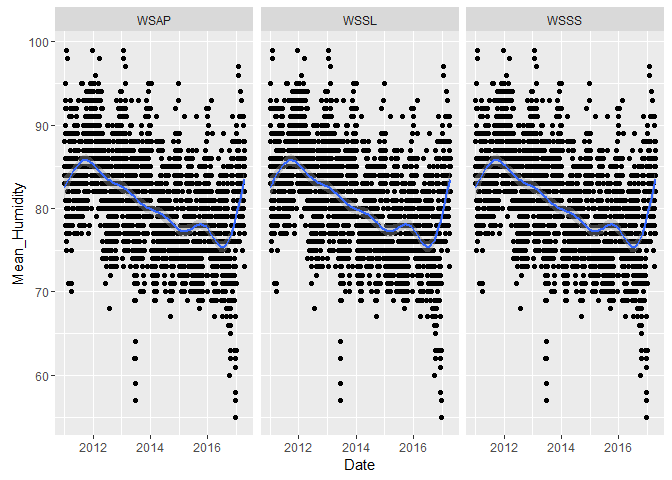
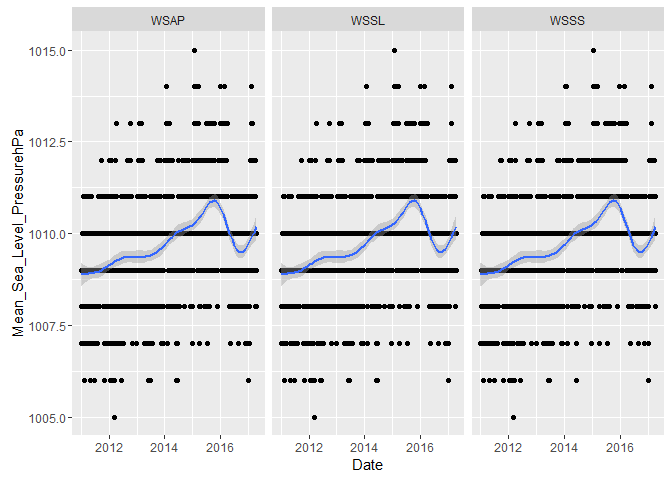
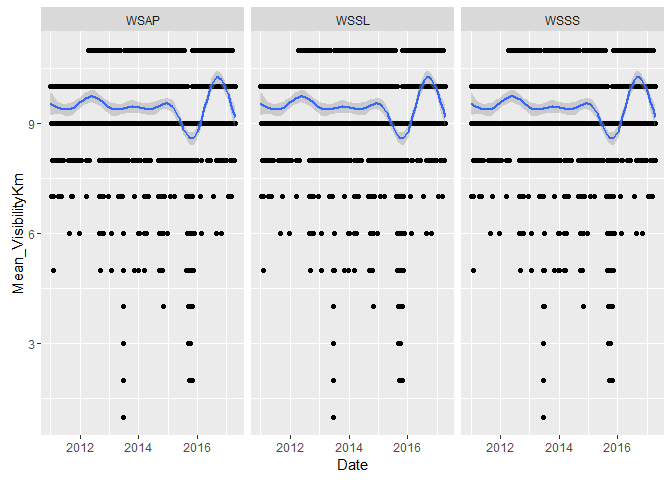
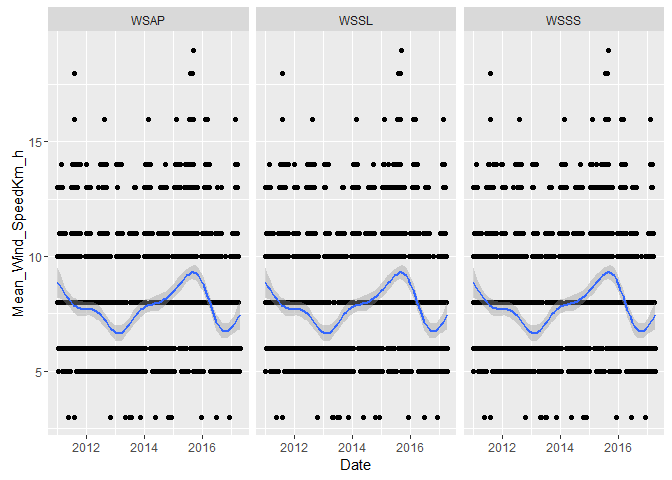
Visualisation of weather data
plotFn <- function(y){
  ggplot(weatherData, aes_string("Date", y)) +
  geom_point() +
  geom_smooth() +
  facet_wrap(~Station)
}


var <- grep("Mean", names(weatherData), value=T)
lapply(var, plotFn)
Written on April 14, 2017