Passing list to a function - `do.call`
One of the frustration in R is writing in long repeated arguments when executing a function. For example, if we were to plot several ggplots objects as a single, we can specify each plot separately in gridExtra::grid.arrange function, e.g. grid.arrange(ggplot_obj_1, ggplot_obj_2, ggplot_obj_3, ...).
Using the mtcars data-set to illustrate, we first form 5 ggplot objects in a list p by plotting each of the 5 variables (mpg, cyl, disp, hp, drat) separately against wt:
library(ggplot2)
mtPlot <- function(x) ggplot(mtcars, aes_string(x, "wt")) + geom_point()

p <- lapply(c("mpg", "cyl", "disp", "hp", "drat"), mtPlot)
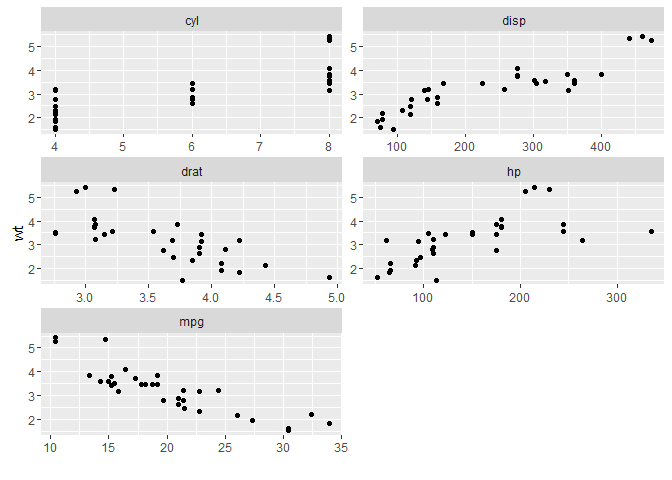
In order to plot all the 5 ggplot objects in p as a single image, we can run it with grid.arrange like:
library(gridExtra)
grid.arrange(p[[1]], p[[2]], p[[3]], p[[4]], p[[5]])
Alternatively, using the do.call function, we can pass the list of objects to grid.arrange:
do.call("grid.arrange", p)
Both would result in the same figure as above.
do.call
do.call function is a extemely nifty means of executing function with a list. It constructs and execute a function call from a name of function and a list of arguments to be passed to it.
do.call
## function (what, args, quote = FALSE, envir = parent.frame())
## {
##     if (!is.list(args))
##         stop("second argument must be a list")
##     if (quote)
##         args <- lapply(args, enquote)
##     .Internal(do.call(what, args, envir))
## }
## <bytecode: 0x0000000007be8a28>
## <environment: namespace:base>
Examples
do.call("complex", list(imag=1:3))
## similar to complex(imag=1:3)
## [1] 0+1i 0+2i 0+3i
Using the do.call function to pass a list of parameters onto sample
parms1 <- list(x=letters, size=5, replace=T)
set.seed(44)
do.call(sample, parms1)
## similar to sample(x=letters, size=5, replace=T)
## [1] "t" "h" "n" "o" "a"
parms2 <- list(x=LETTERS, size=10, replace=T)
do.call(sample, parms2)
## similar to sample(x=LETTERS, size=10, replace=T)
## [1] "D" "L" "B" "C" "L" "C" "A" "V" "D" "L"
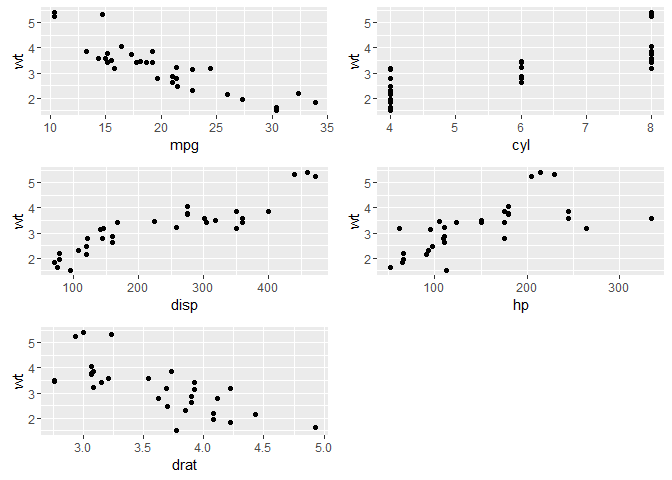
Back to the mtcars example, to get a 5 x 1 image, concatenate the list with additional argument nrow=1
do.call(grid.arrange, c(p, nrow=1))
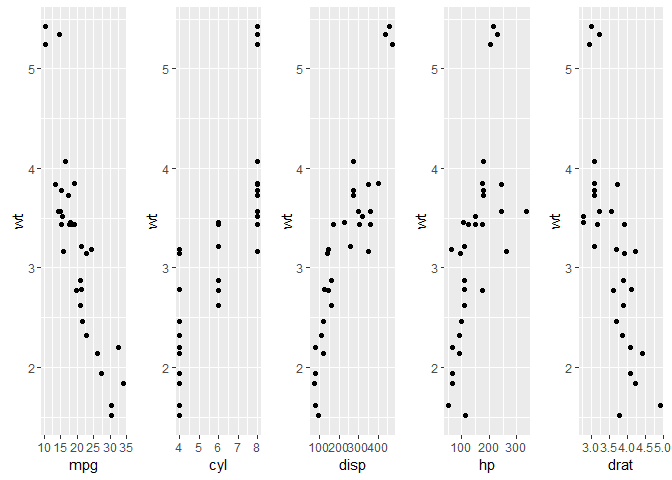
Note: the easiest way of replicate the mtcars figure example above is through facet_wrap:
library(dplyr)
##
## Attaching package: 'dplyr'

## The following object is masked from 'package:gridExtra':
##
##     combine

## The following objects are masked from 'package:stats':
##
##     filter, lag

## The following objects are masked from 'package:base':
##
##     intersect, setdiff, setequal, union
library(tidyr)
ggplot(mtcars %>% gather(var, val, mpg, cyl, disp, hp, drat), aes(val, wt)) +
  geom_point() +
  facet_wrap(~var, ncol=2, scales="free") +
  xlab("")